Motivation
Using Maxar’s leading satellite imagery, we can determine water depth and shore line location before and after a major tectonic event. We can use this to rapidly and safely survey an area and quantify change. After an event such as the 2016 Kaikōura quake, we can instantly detect and quantify the coastal uplift (or subsidence) of land; i.e. what area of land was uplifted and by how much did it rise. Having instant access to reliable survey data will significantly speed up recovery planning, if required. It can also be instantly passed onto scientists, who can use it to determine what type of tectonic event has occurred (for future predictions of change and adversity), as well as any biological/ecological impacts.
Bathymetry
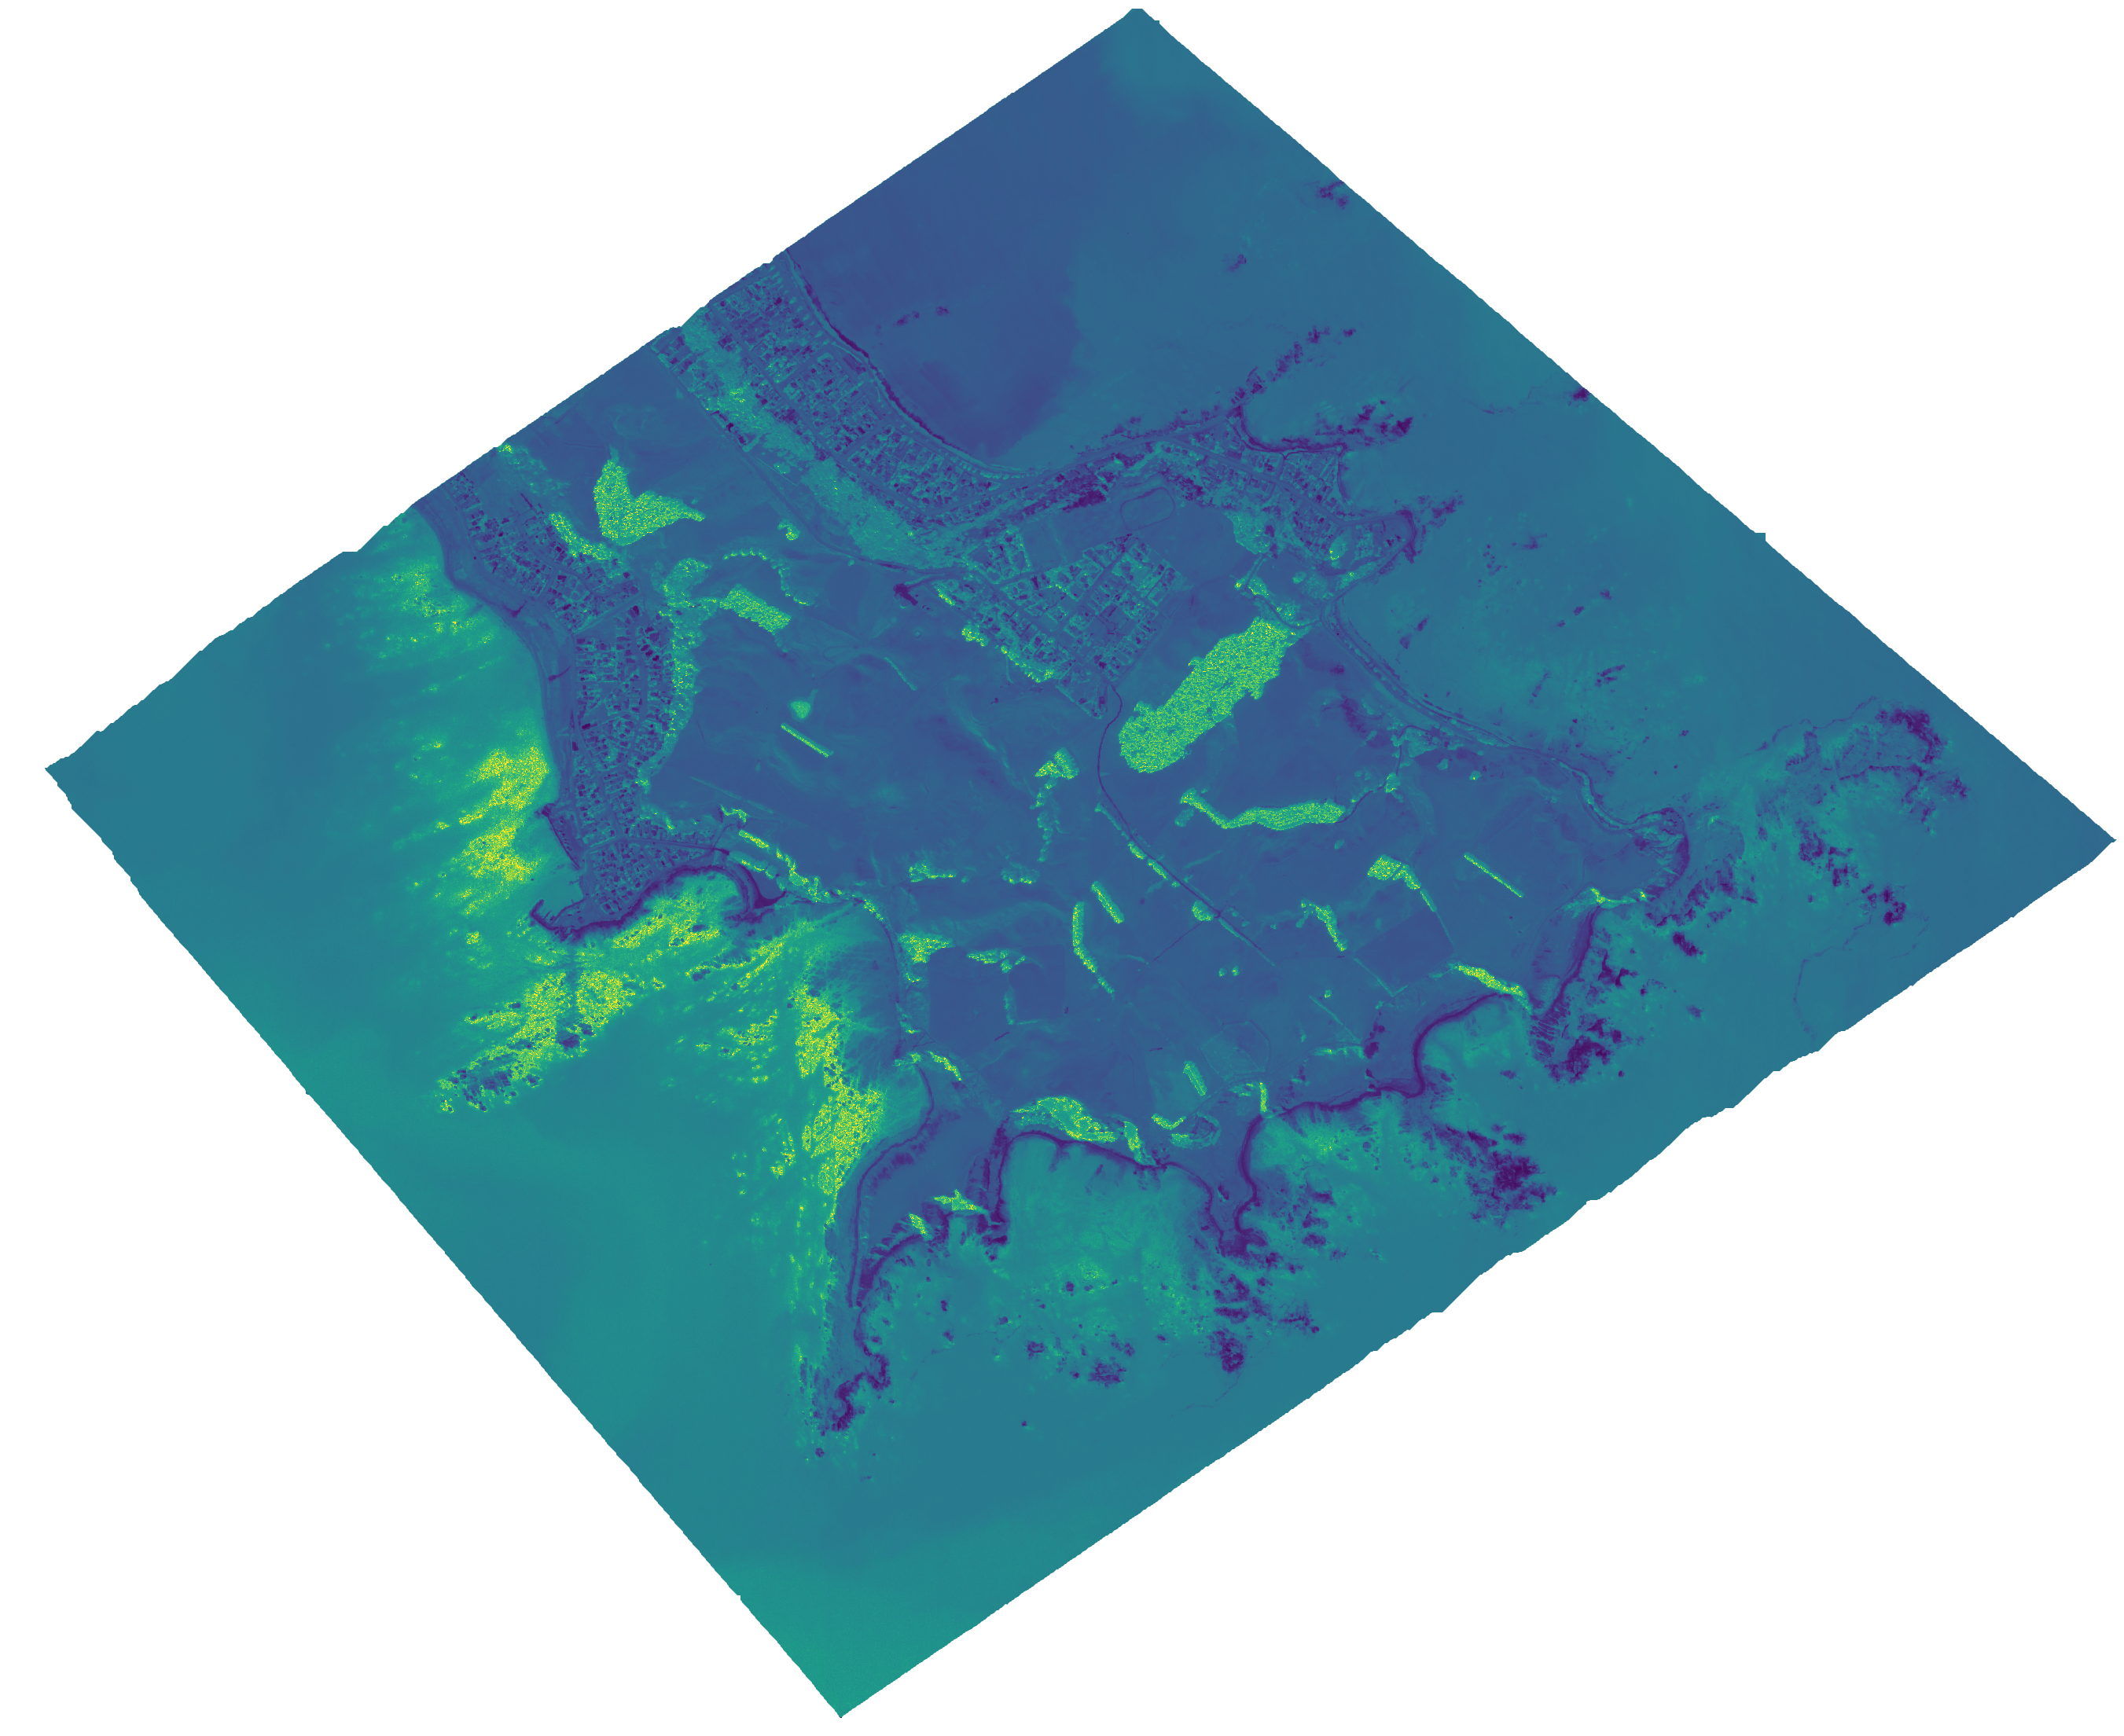
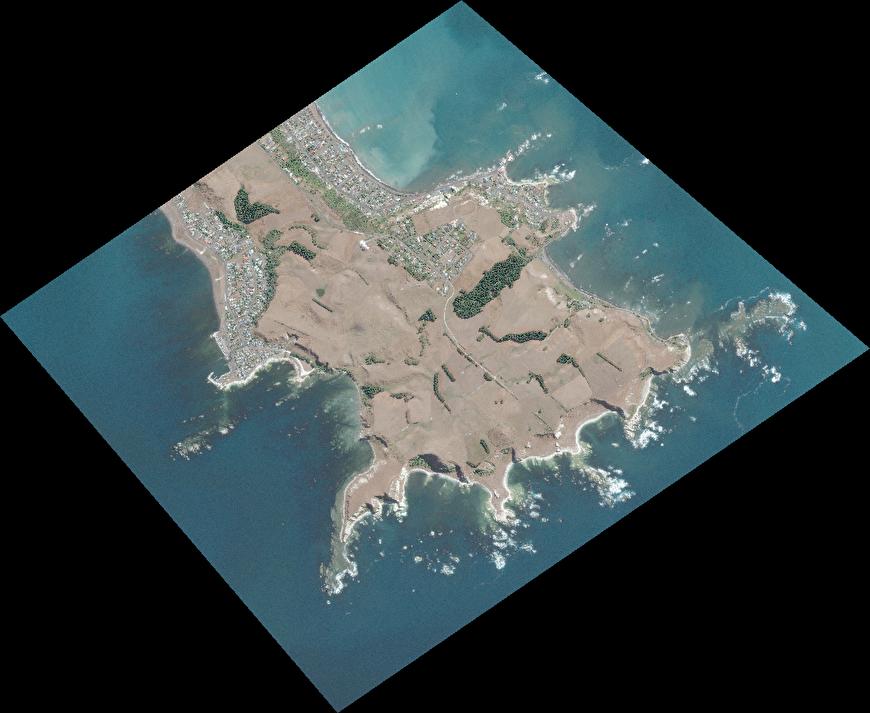
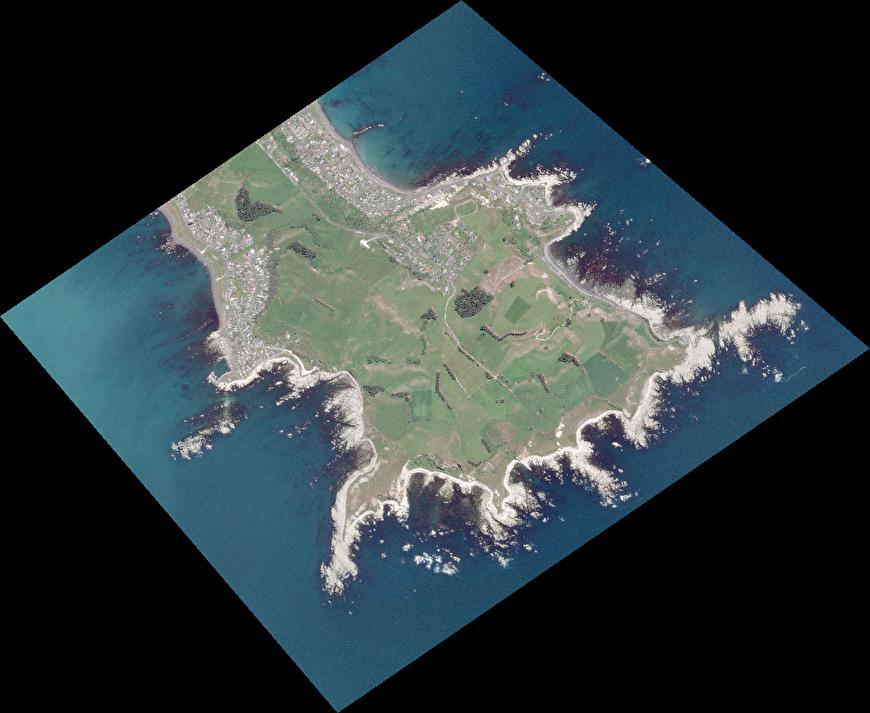
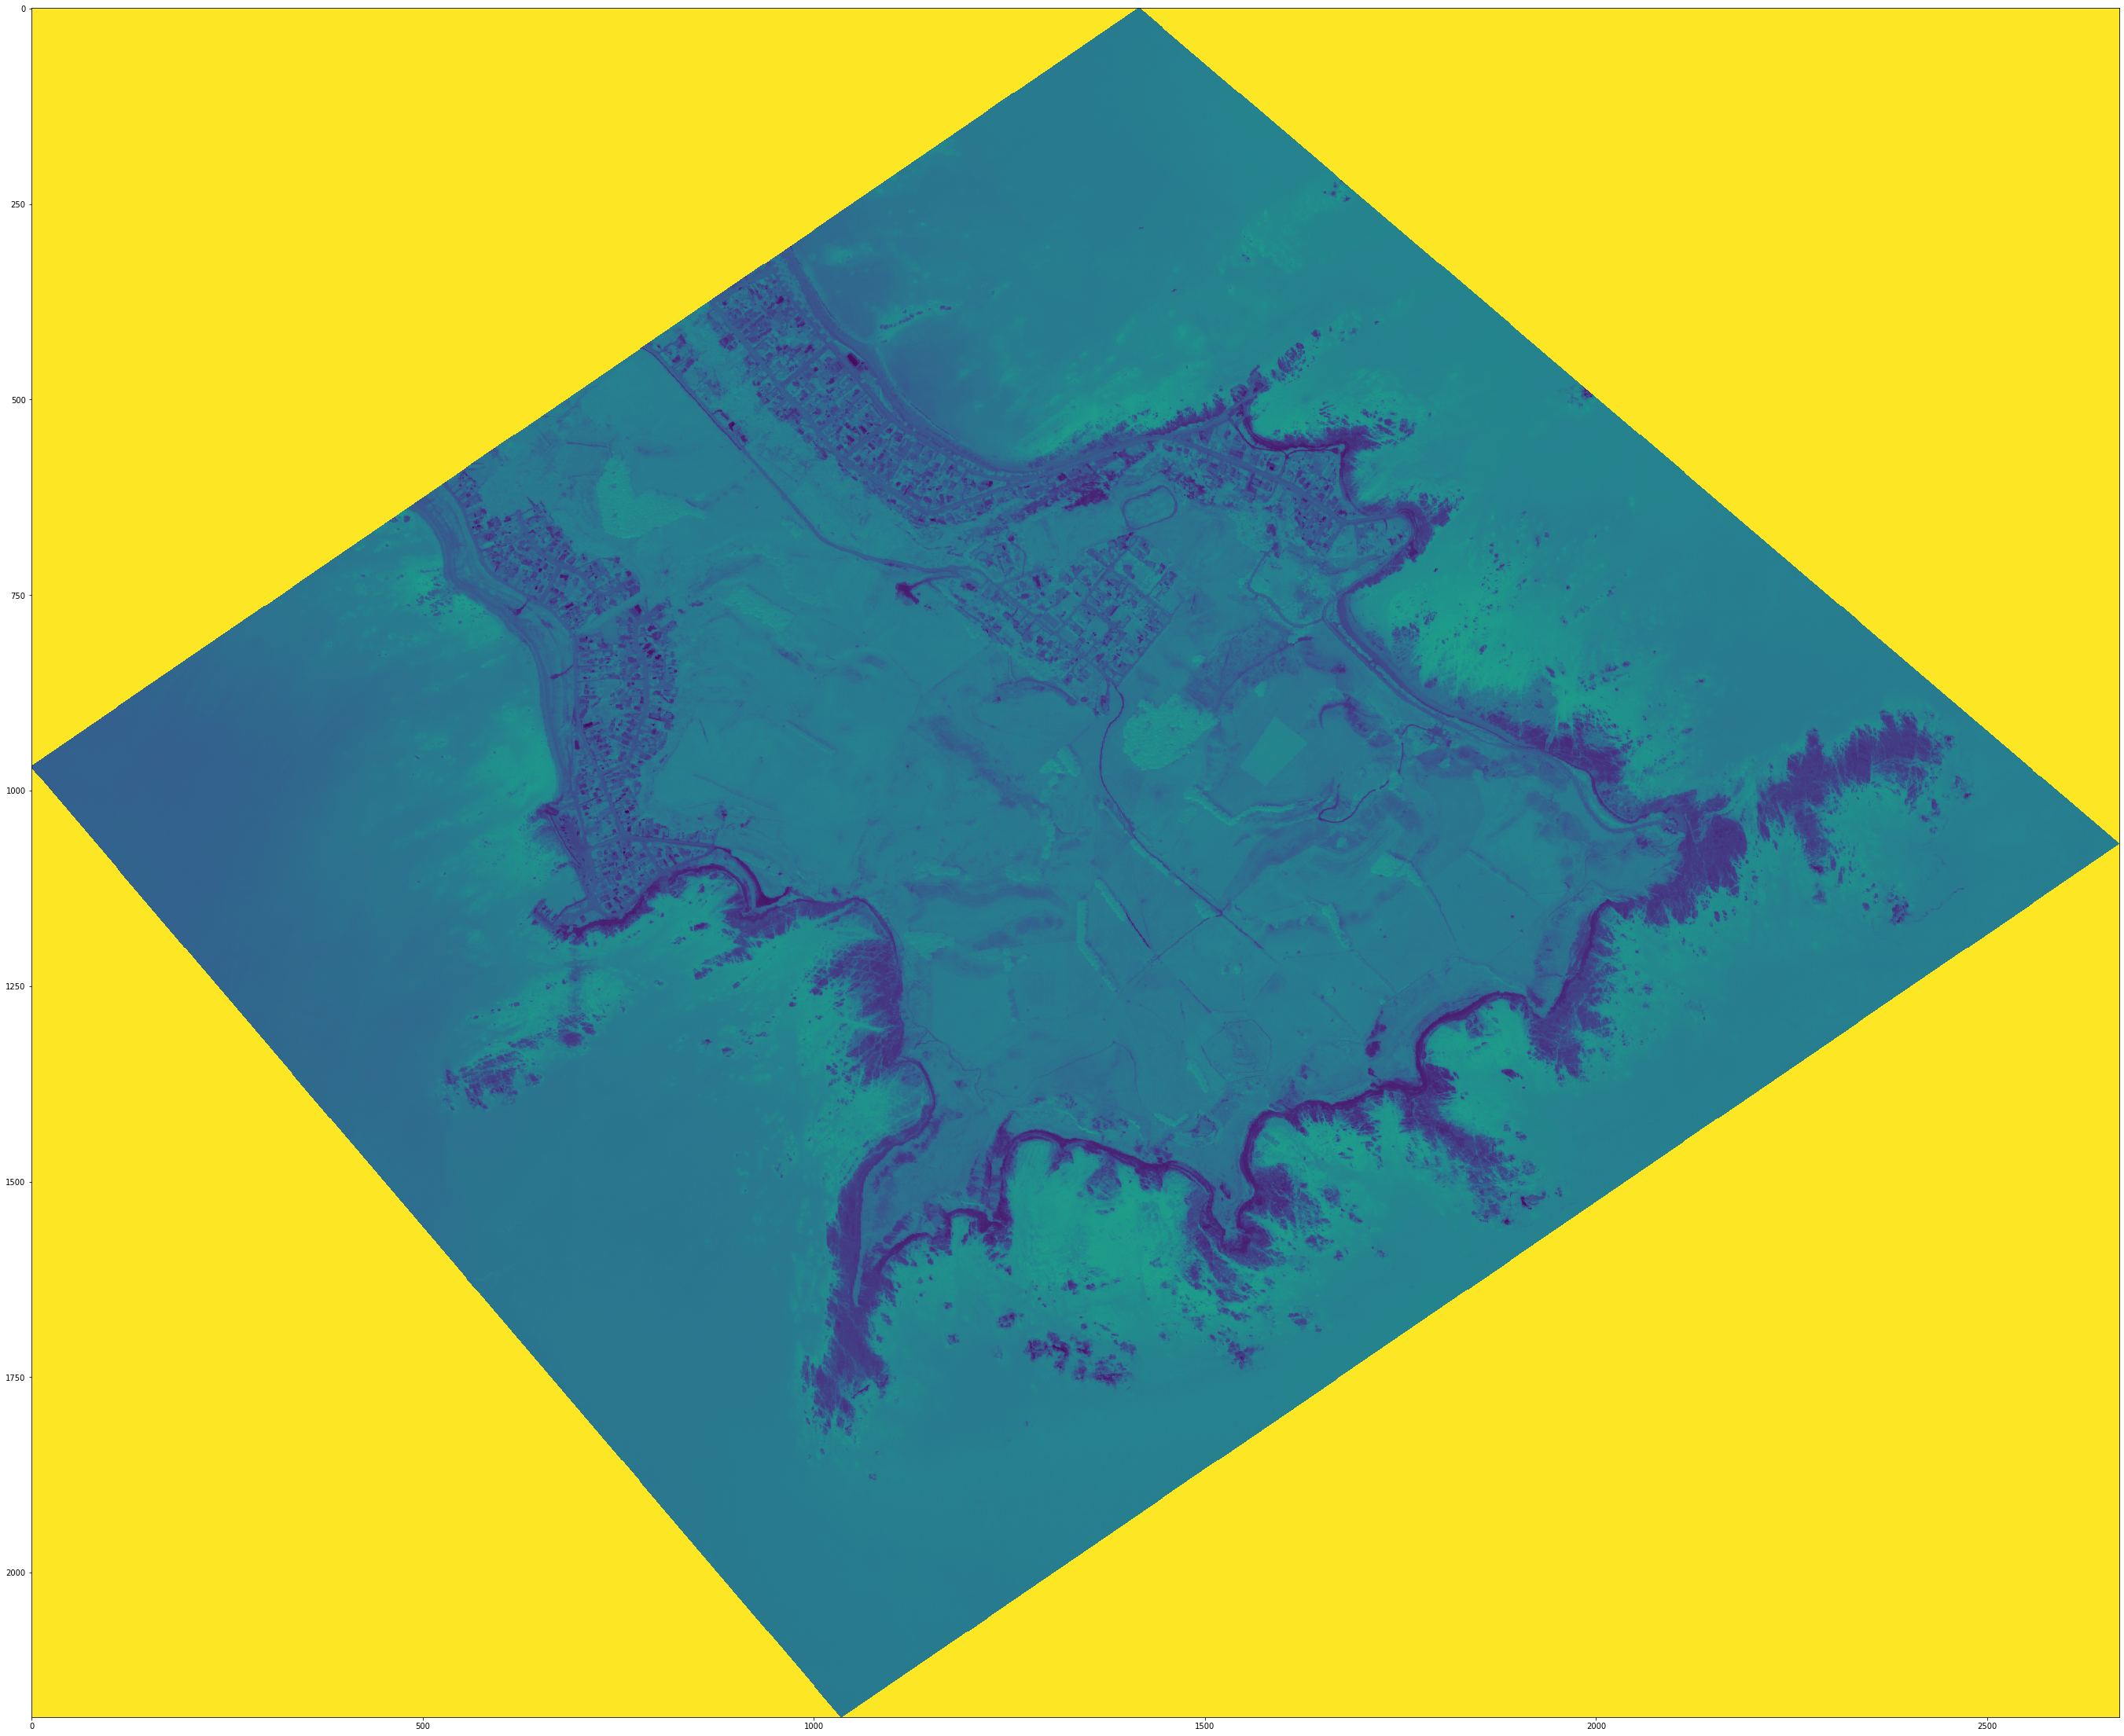
Using a techniques published in 2019 by Princeton University (Geyman & Maloof 2019), we were able to use the multispectral data (namely the coastal blue, blue and green data) to capture information about the water depth. Pictured here is a comparison of our depth map for a coast line in the Kaikōura region. A place we chose to focus on specifically to evaluate the effect of the recent earthquake in the vicinity. To perform the calculations required to find the depth, we had to find both the radiance and reflectivity before subsituting them into the formulae. This new insight allows us to better understand the changes caused to coast lines by undersea earthquakes.
Kmeans Clustering Classification
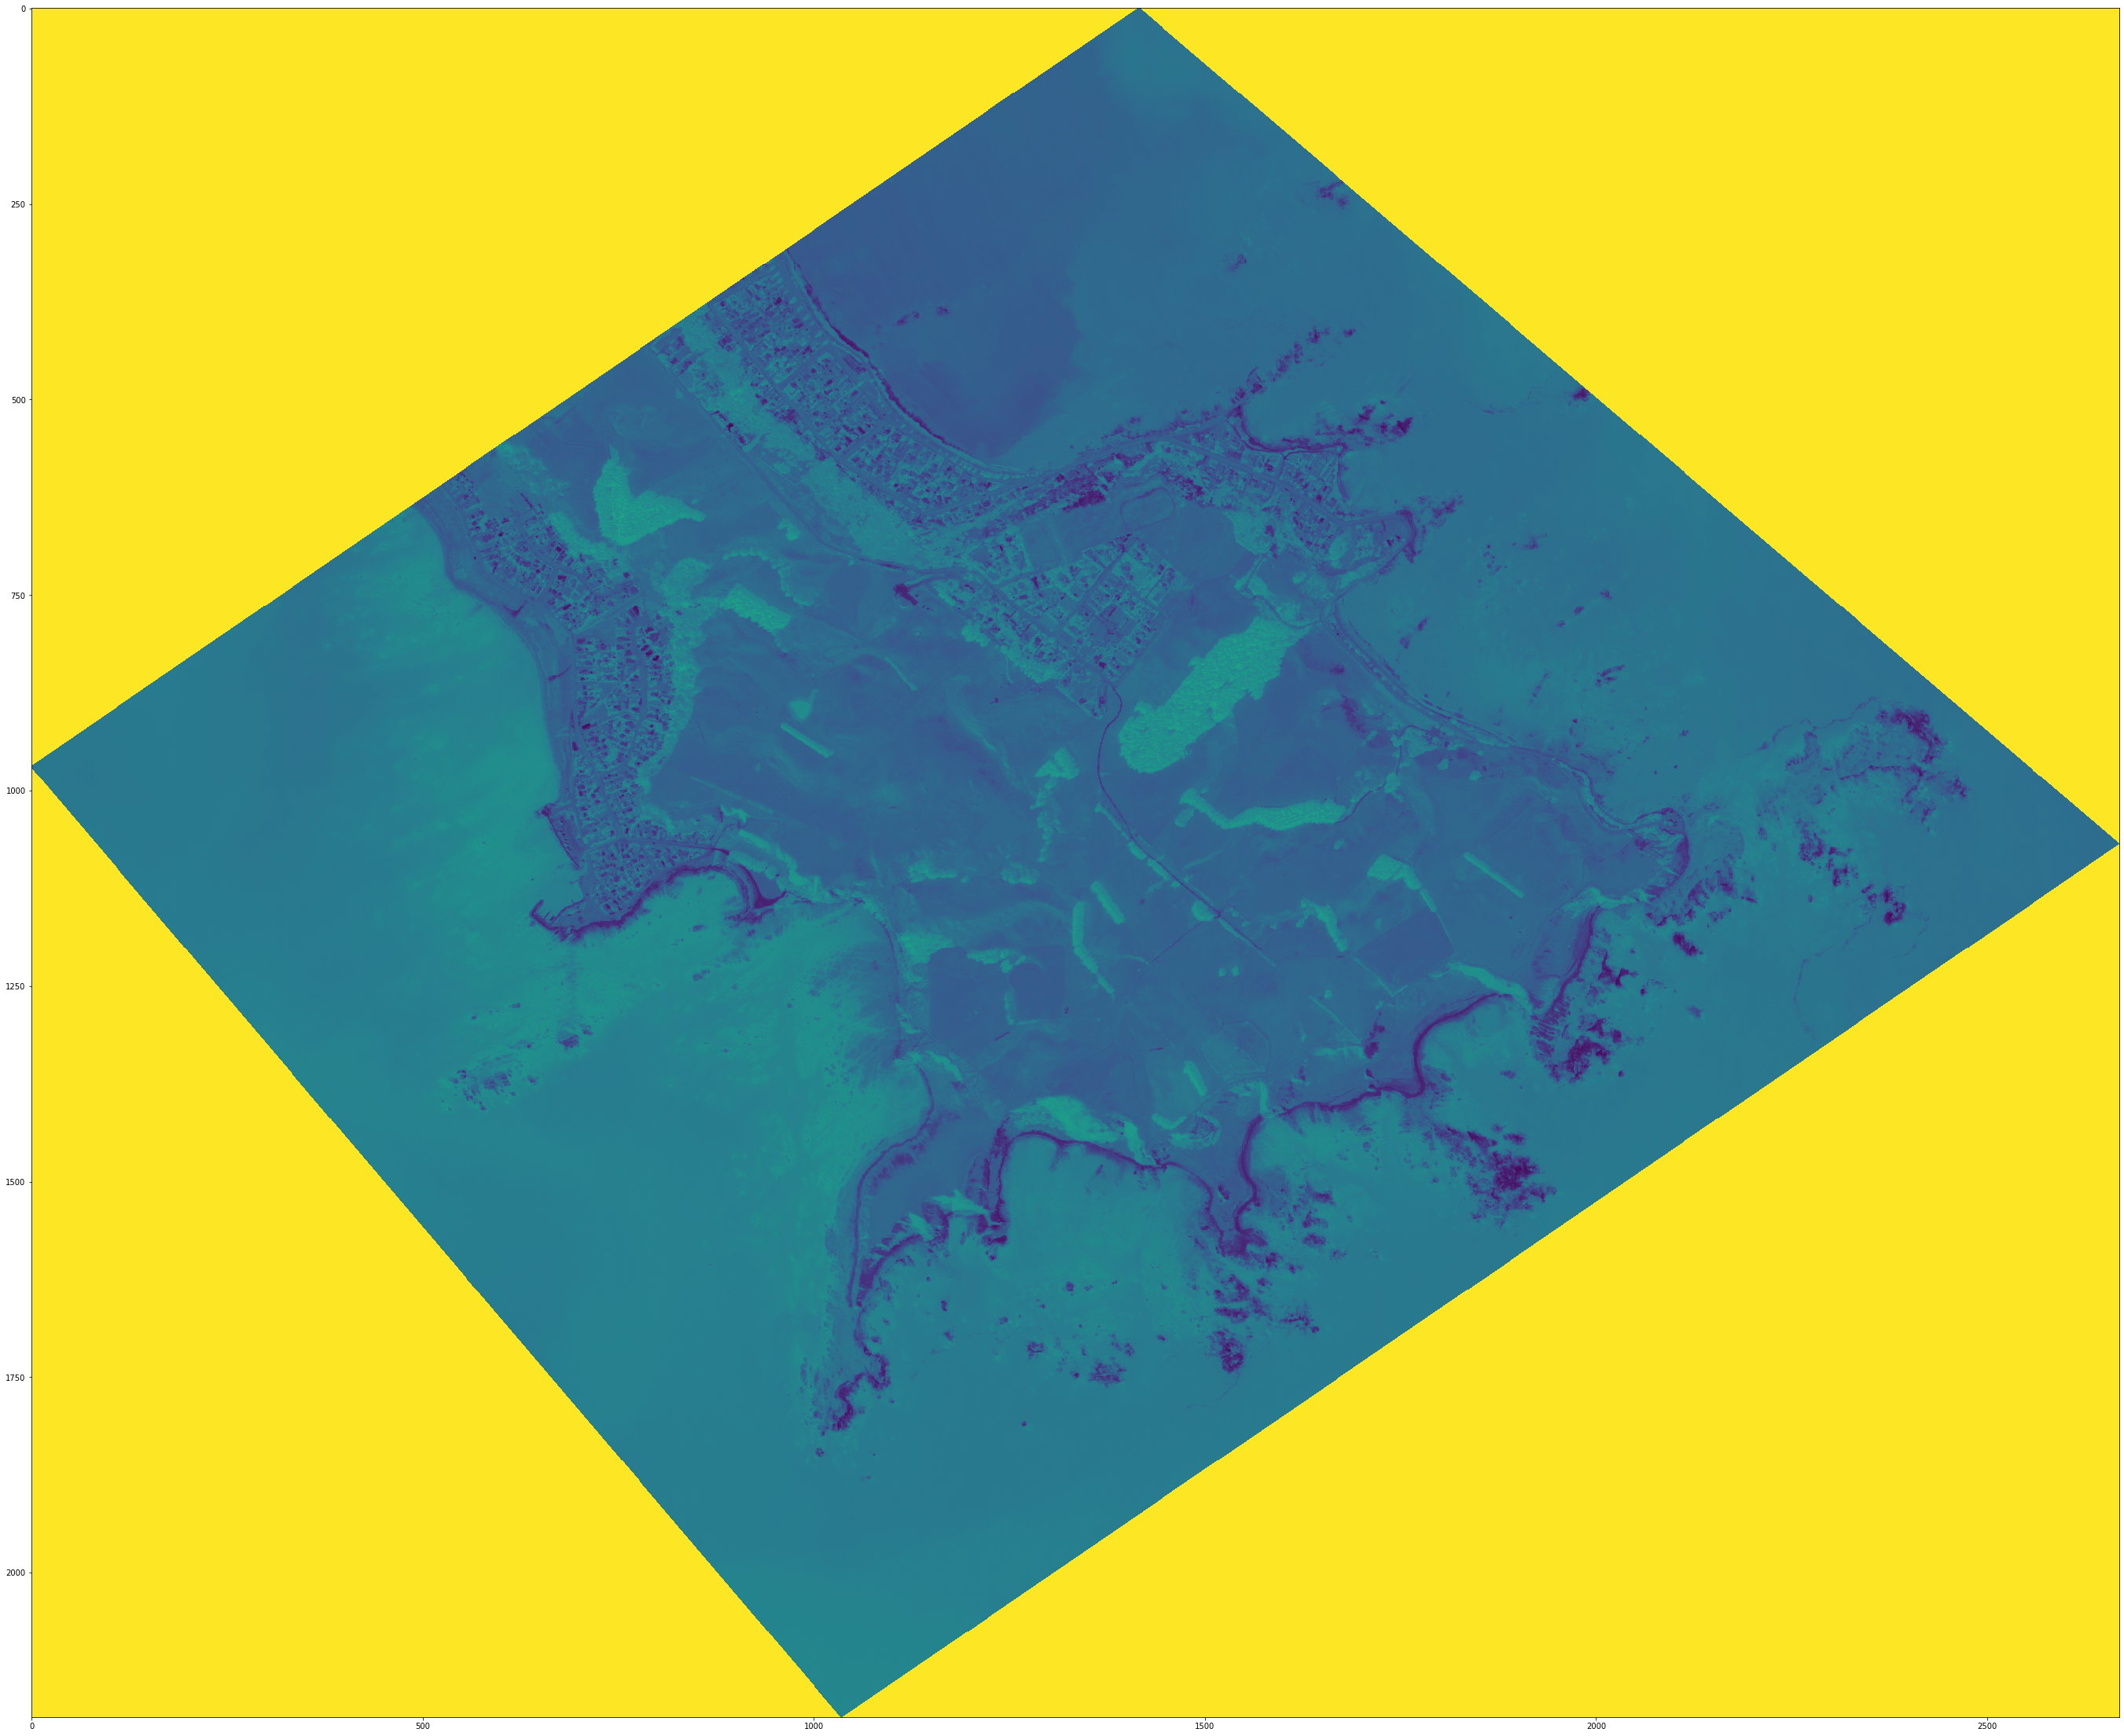
After receiving the data, we proceeded with unsupervised classification. This was due to the fact that we were given a limited data-set that would have only suffered in usability from the train-test split process of supervised classification and how the image view and bands feature of geospatial satellite data can provide a reliably accurate identifications of colour with their corresponding environmental form. From there, we fitted Kmeans() as well as MiniBatchKMeans() with the argument n_clusters = 8, to ensure significant detail without being pedantic in the isolation of our clusters.
By segmenting colour clusters and providing the corresponding correct labels, we could classify and observe the evolving territories of the coast, rural land and urban areas (if there were some). Currently, this is what the prototype achieves. Given more time, we would have classified more models, collated them to assess any patterns, growth and changes in the environment throughout time. Furthermore, we would have definitely tried other clustering-type classification models such as K-Nearest Neighbours, to compare and assess any shortcomings our model may have and any benefit the alternative model would provide.
As we performed unsupervised machine learning, we have the benefits of identifying any potential anomalies that stray from their respective clusters as well as identifying any patterns known and unknown from the data.
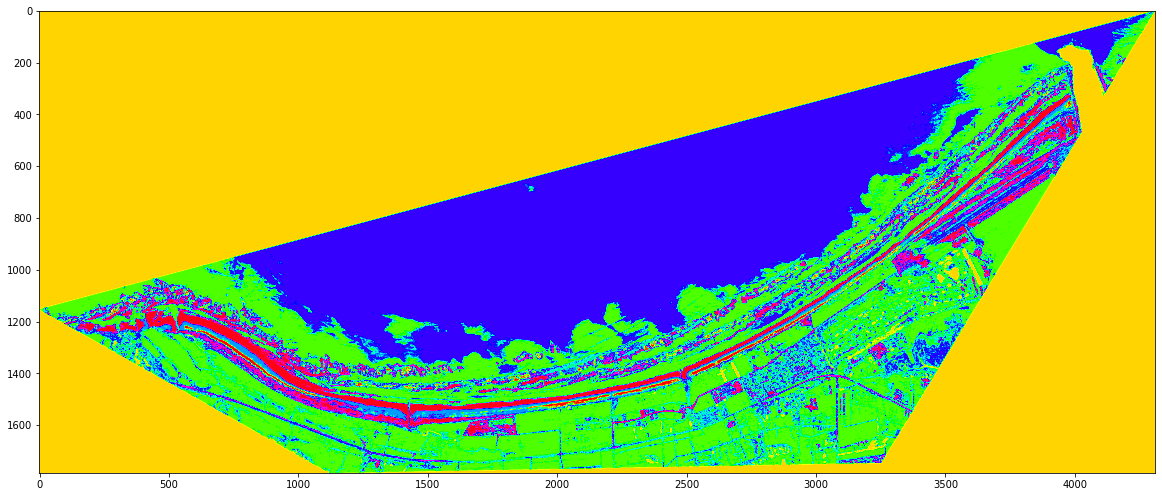 model 1: 12MAR28
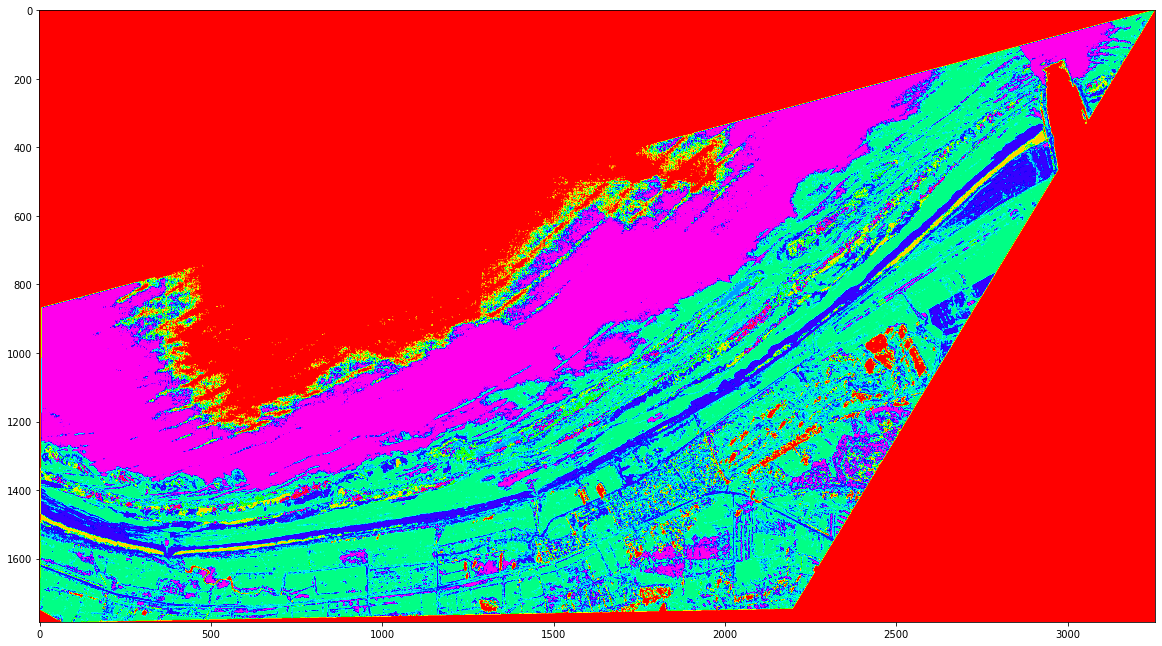 model 2: 14JUL19